Python, Django
Alphalytix
A financial analytical system
Alphalytix
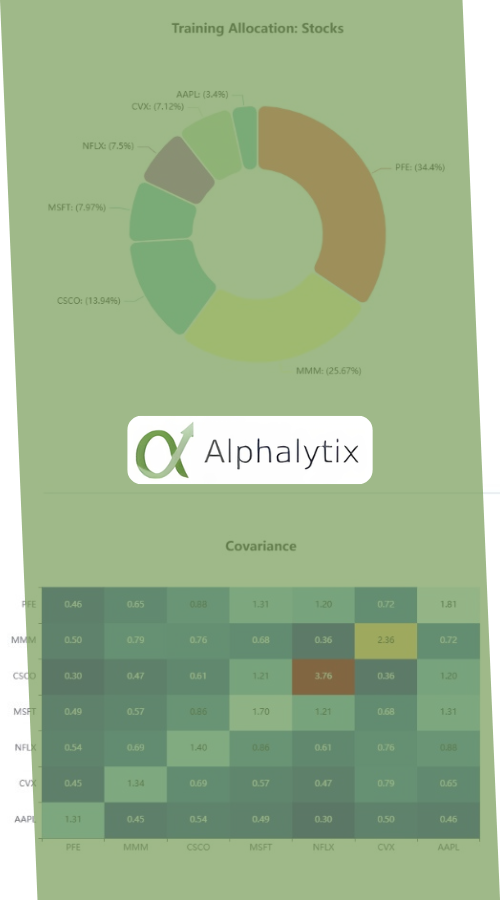
Strategy Level Data Visualization
Visualize specific strategy data using pie chart and heatmap.
Alphalytix
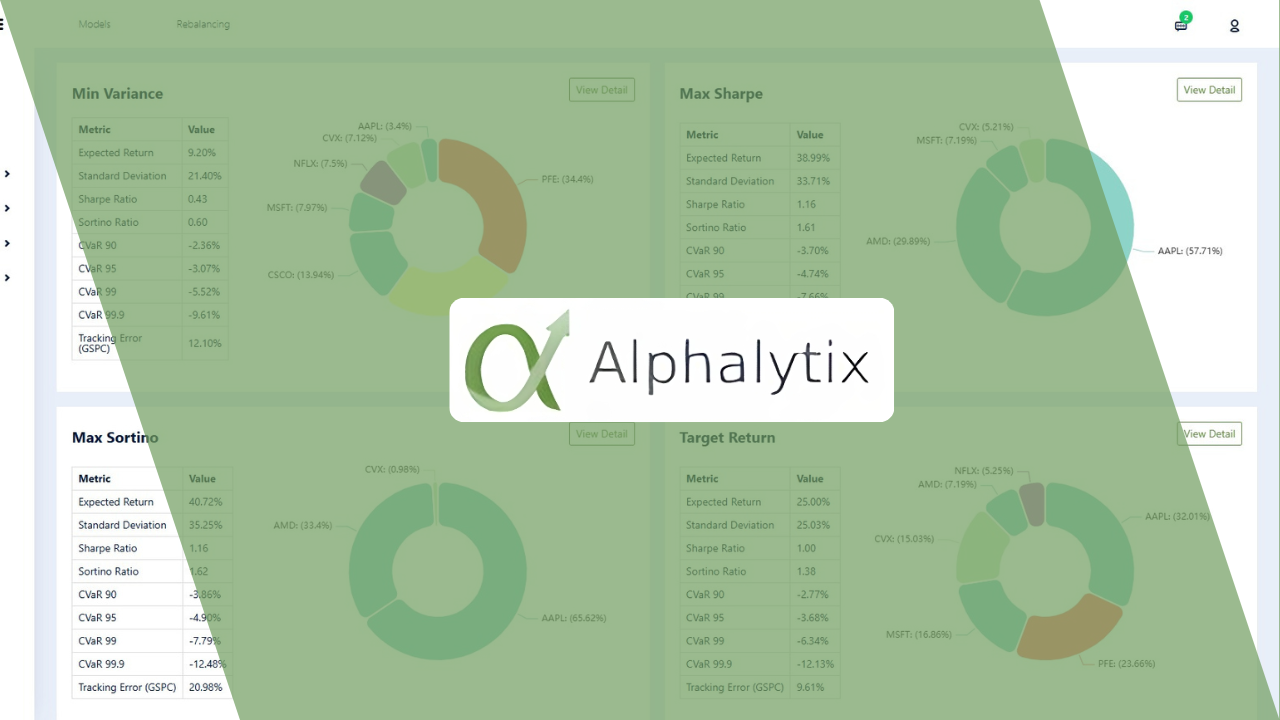
Summary Level Data
It represents summary level data generated by financial model.
Alphalytix
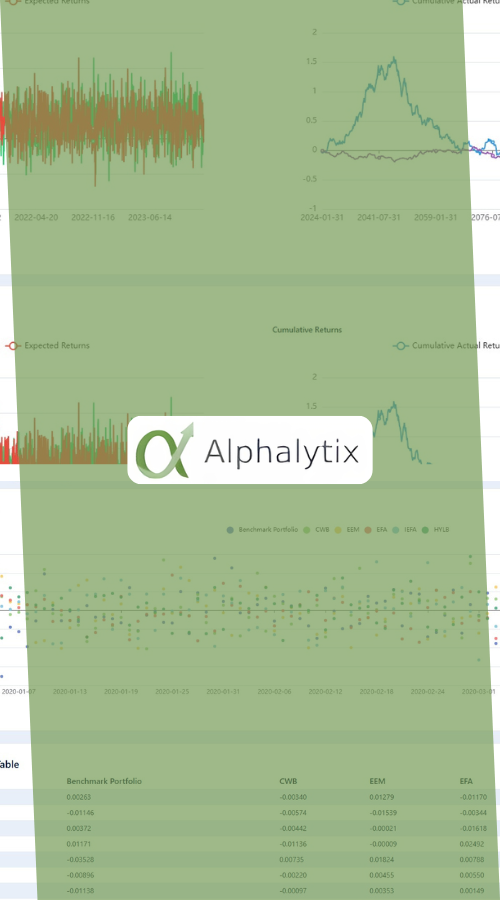
Residuals & Over-Under Charts
Alphalytix
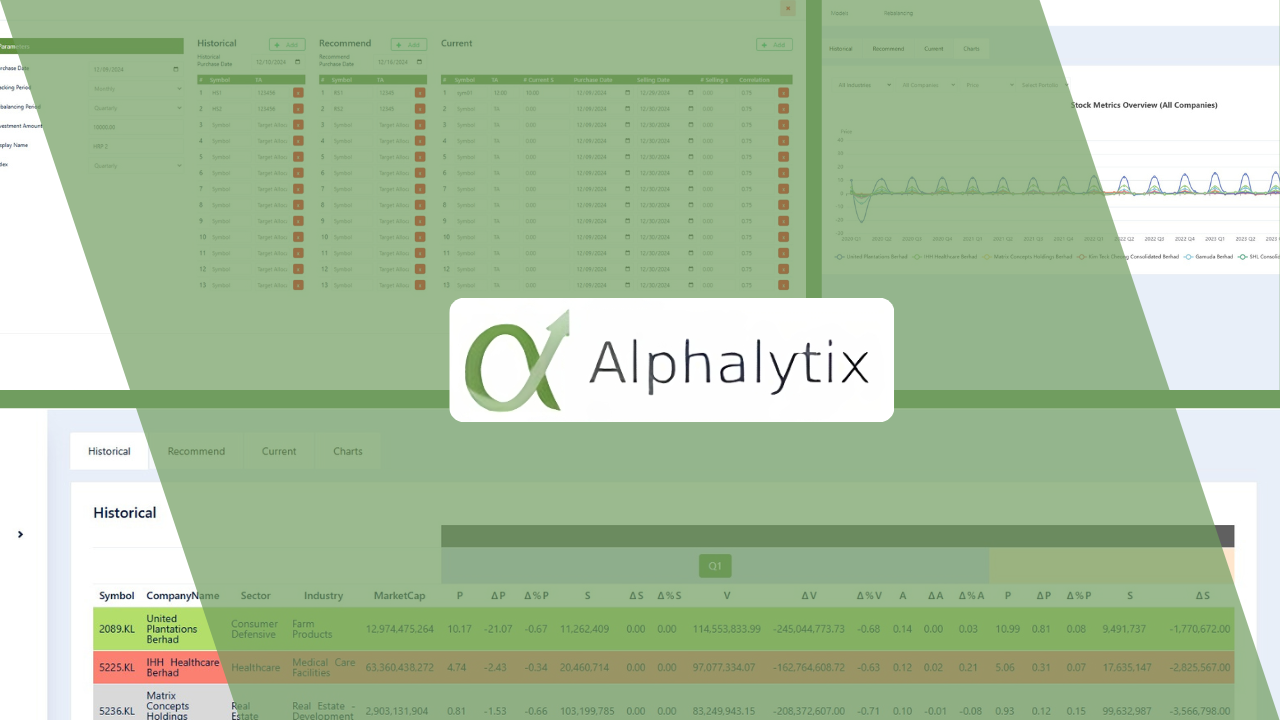
Dynamic Input Table with historical data breakdown
They system includes dynamic input table. It has yearly and quarterly breakdown of historical, model recommended and currently used data.
Alphalytix
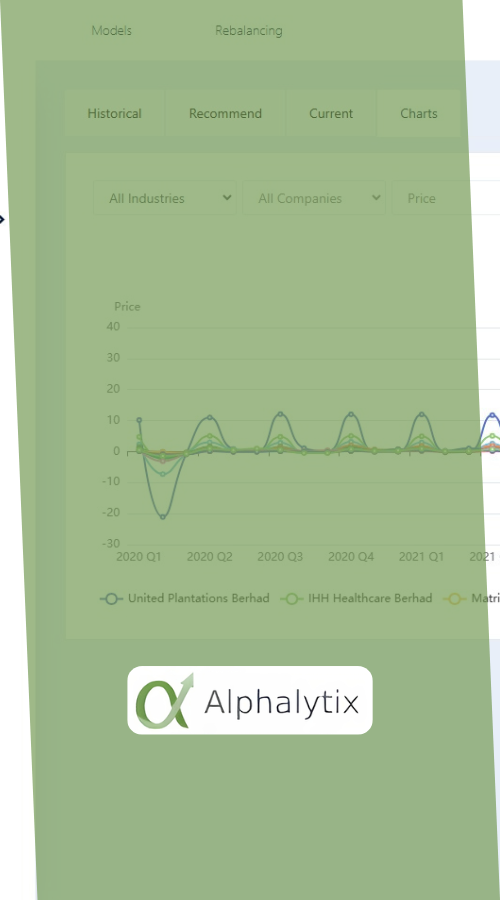
Multi-filtered chart
Dynamic data chart can be filtered based on multiple options including industry, company, price and metric.